例子2,alluvial 安装包
程序:
install.packages(“alluvial”)
library(“alluvial”)
n <- 100
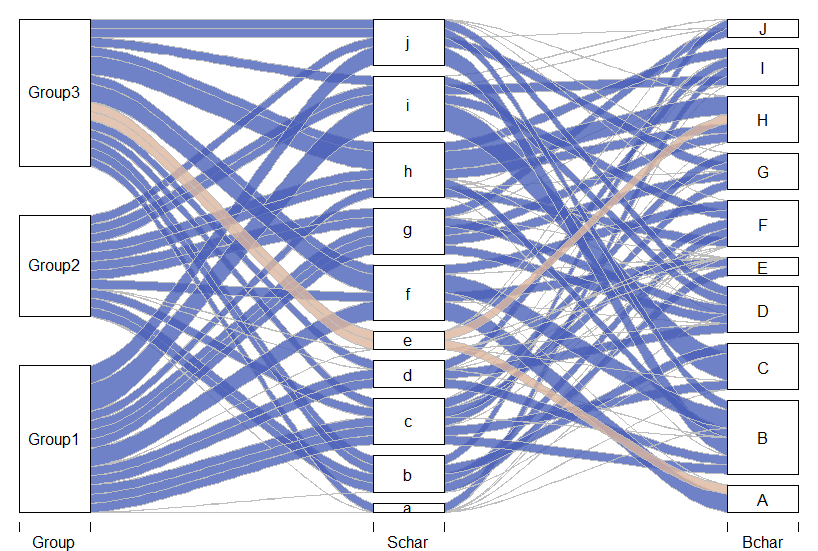
TestData <- data.frame(“Group” = sample(paste0(“Group”, 1:3), n, replace = TRUE),
“Schar” = sample(letters[1:10], n, replace = TRUE),
“Bchar” = sample(LETTERS[1:10], n, replace = TRUE),
“Count” = sample(c(0, 1), n, replace = TRUE))PlotData <- aggregate(formula = Count~Group+Schar+Bchar, data = TestData, FUN = sum)
alluvial(PlotData[, 1:3], freq = PlotData[, 4], xw = 0.1, alpha = 0.8,
gap.width = 0.2, col = ifelse(PlotData[, 2] == “e”, “#deb7a0”, “#4b61ba”),
border = “gray”, layer = PlotData[, 2] != “e” )
图示: